
Biodiversity / Ecosystem Function Relationships
It has become routine in ecology to assume that
biodiversity is, at
least to some degree, responsible for the functioning of ecological
communities. This notion is now the foundation of a major argument in
favour of conservation, though some do question it. As usual, the
extent to which it is true critically depends on the precise
definitions used for both biodiversity and ecosystem function. If we
define biodiversity as the system’s total functional information, then
function rather obviously follows from that. For this reason, we
believe the
ideas presented on this website cast a strong light on the Biodiversity
- Ecosystem Function debate.
Below we show one of the most comprehensive BEF relations, generated by simulation of ecological communities, to date (Fung et al., 2015). The graph shows the effect of gradually removing 'species' (from right to left on the x-axis), from a system of originally several thousand (though only the simulated 'fish' species are removed). Clearly there is a systematic relationship between the production rate (growth and reproduction of fish) and species richness. However, production rate is a single and rather crude measure of ecological function and it is not surprising that in this measure, we see evidence of considerable functional redundancy among 'species'. What is really happening here is that as species are lost, others take up the workload of production in compensation, but gradually the extra workload for each of those fewer and fewer remaining species becomes relatively greater - they fall behind in their compensating and the curve dips down. This has little to do with information, but that is because it is so crude a representation of both biodiversity and function. We would like to develop a more sophisticated simulation, but that currently awaits the necessary funding.
Below we show one of the most comprehensive BEF relations, generated by simulation of ecological communities, to date (Fung et al., 2015). The graph shows the effect of gradually removing 'species' (from right to left on the x-axis), from a system of originally several thousand (though only the simulated 'fish' species are removed). Clearly there is a systematic relationship between the production rate (growth and reproduction of fish) and species richness. However, production rate is a single and rather crude measure of ecological function and it is not surprising that in this measure, we see evidence of considerable functional redundancy among 'species'. What is really happening here is that as species are lost, others take up the workload of production in compensation, but gradually the extra workload for each of those fewer and fewer remaining species becomes relatively greater - they fall behind in their compensating and the curve dips down. This has little to do with information, but that is because it is so crude a representation of both biodiversity and function. We would like to develop a more sophisticated simulation, but that currently awaits the necessary funding.
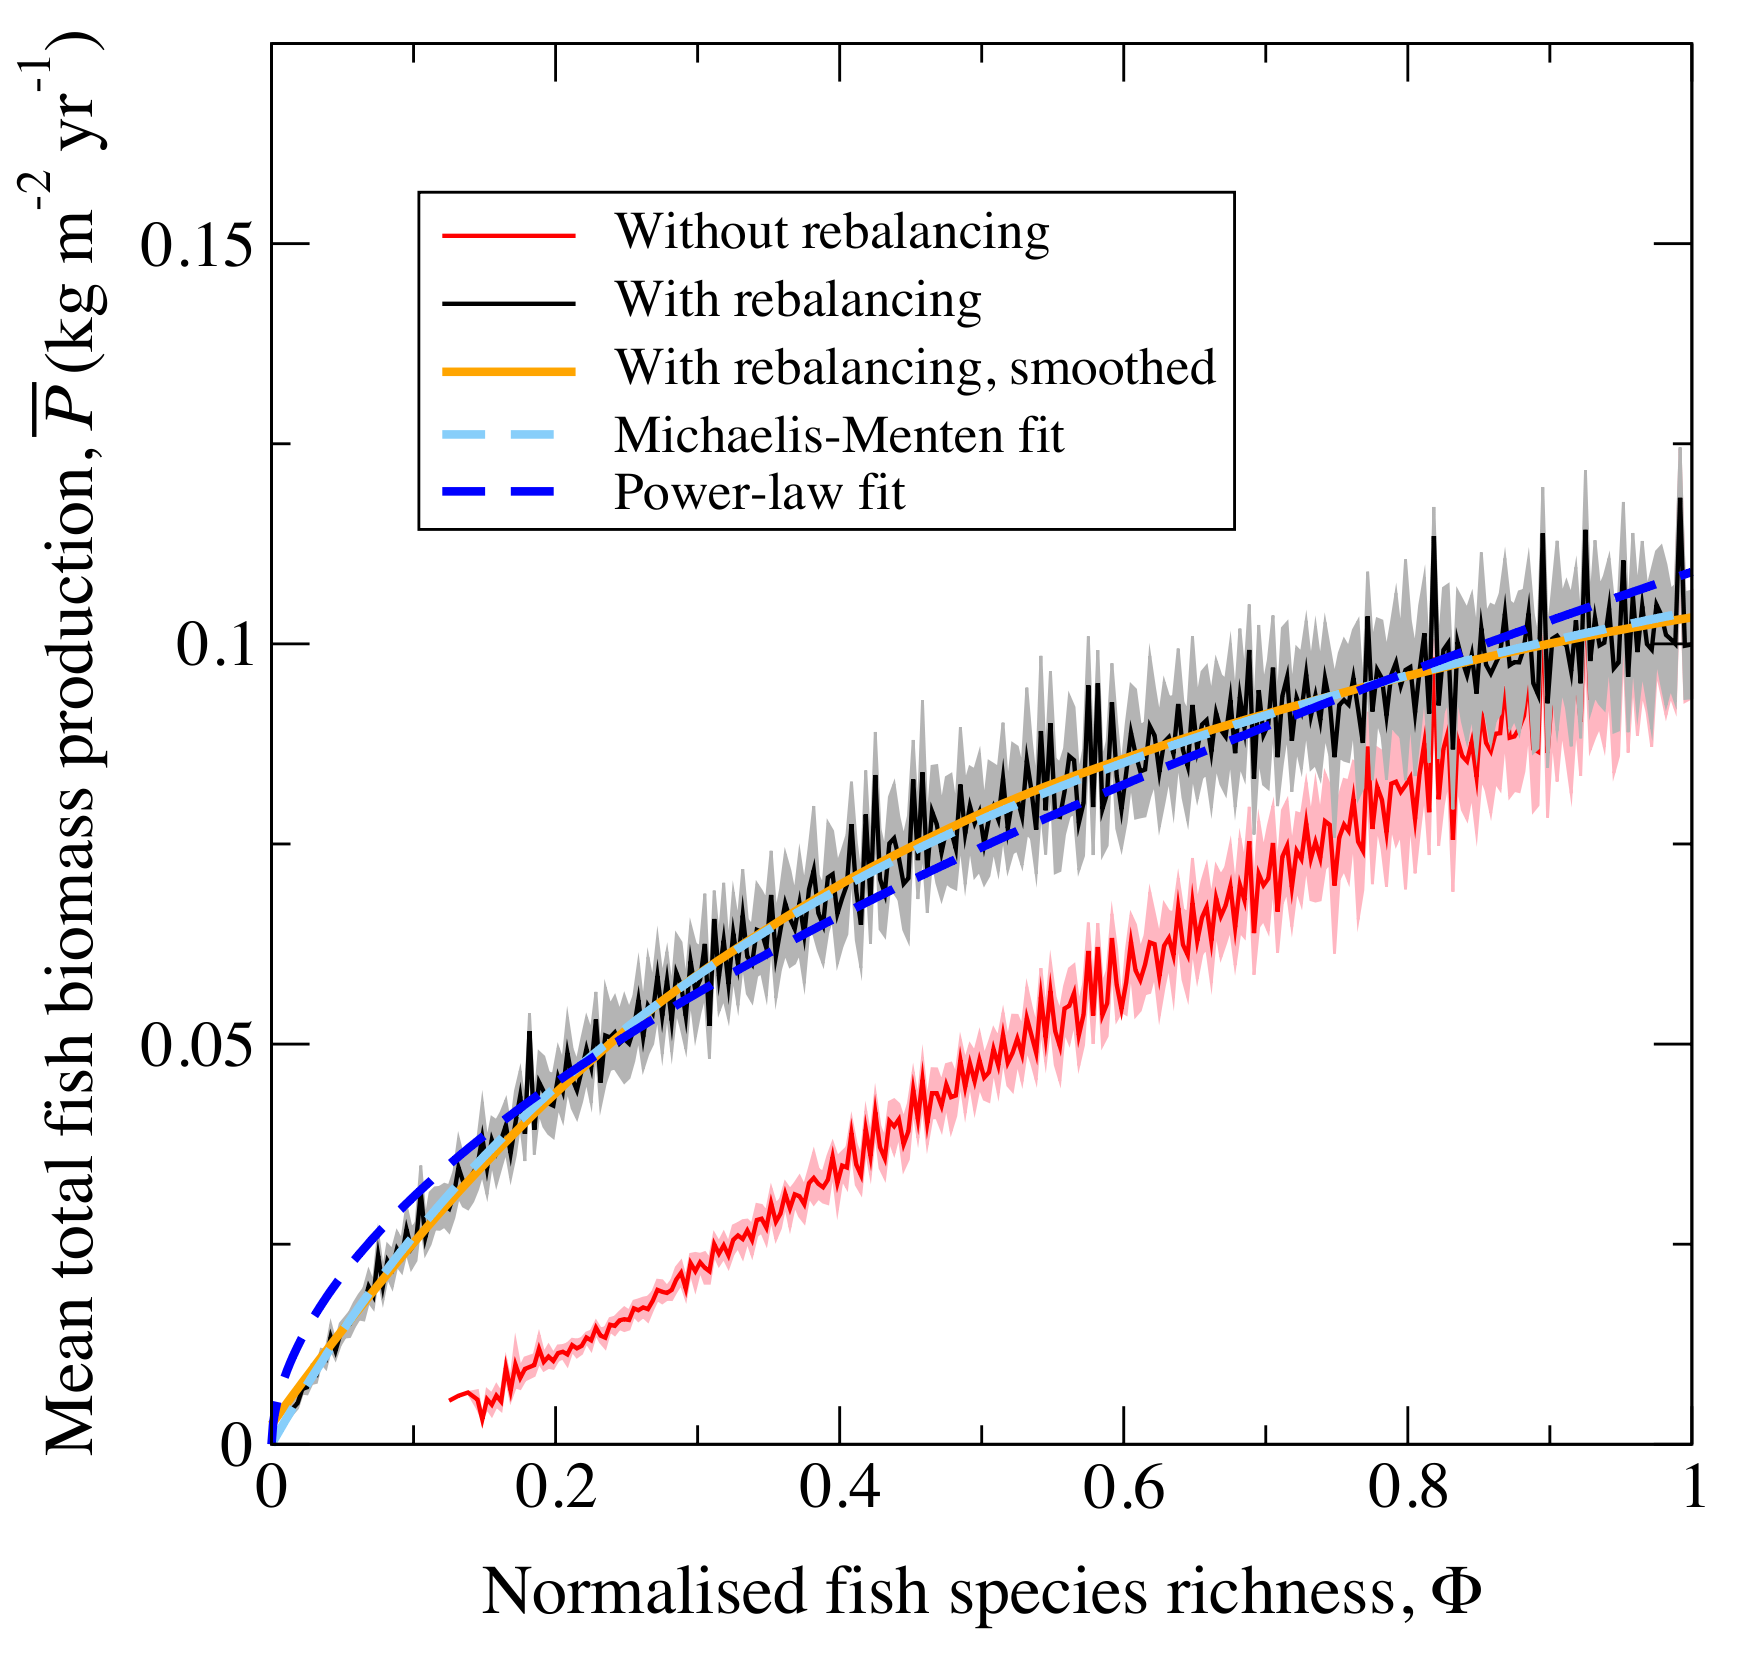
In this figure, you see the effect of
reducing (or increasing) species diversity on the function of biomass
production. The jagged scatter is a result of random species
deletions (each individual species makes a different contribution to
total production and they were selected for deletion at random). The
red line shows what happens when the system is
not allowed to adjust to a new equilibrium (rebalance). The black line
shows the effect of this rebalancing in which the remaining species are
able to adjust to the loss of the removed species. The dashed lines
show statistical models of the biodiversity-function relationship. The
Michaelis Mentin function fits best. The overall result is a prediction
that as species are lost, we would find it hard to detect in total
production, until perhaps as many as half had gone. By that time it
might be too late - it certainly would be for the species lost. Of
course the obvious answer to this is to regularly survey the whole
system, checking that all the species are still present. The practical
impediment to that is that it would cost a lot more money than is
allocated to this sort of work: we are often left trying to imply the
biodiversity from signals like the commercial landings of fish.
In practice, fishing, forestry and other human activities are not affecting species at random: typically the largest, longest living and highest in foodchains (trophic level) organisms are most at risk. Fung et al. 2015, went on to examine the effect of deleting species in rank order and the result was even more striking.
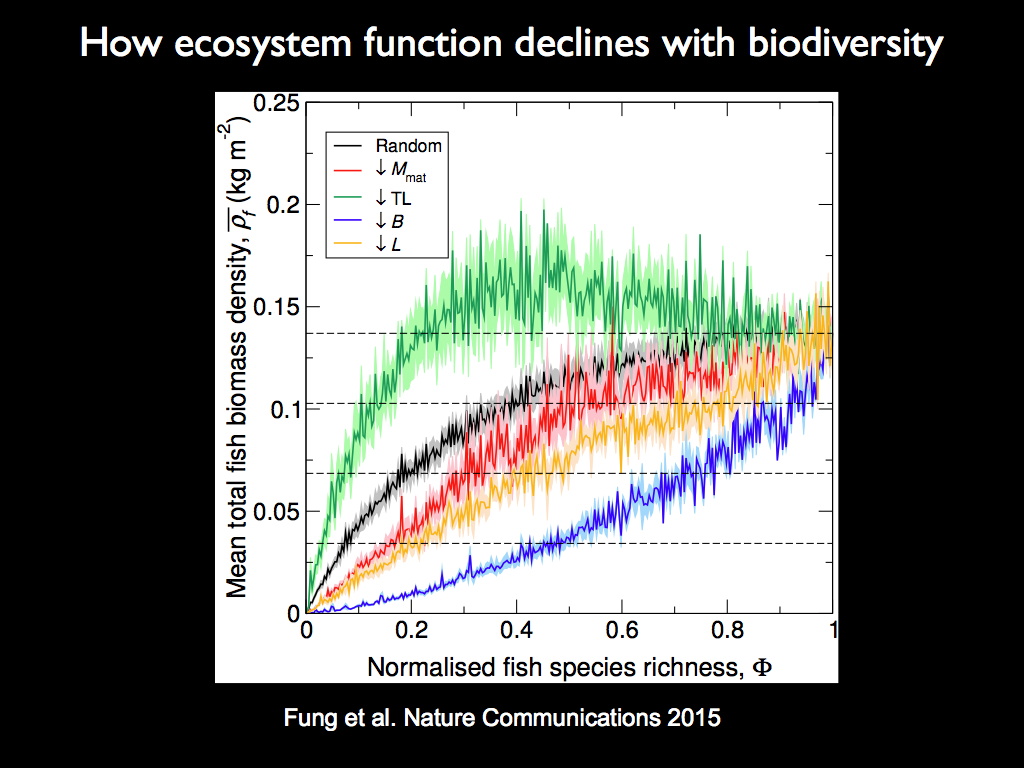
Deleting in reverse order of trophic level (green line) actually caused an initial increase in ecosystem function, before it crashed down after about 2/3 of the species had been eliminated. Conversely, deleting in reverse order of the biomass of individual species populations (red line) resulted in a curve that declined sharply as the first few species were deleted and gradually smoothed out, but at significantly lower production than all the other scenarios. The, often assumed, Michaelis-Menten shape was lost in both these cases and clearly only pertains to random species deletion. Since overfishing typically depleats species from highest to lowest trophic level, the green line is to be expected and this may explain the prevalence of sudden crashes in heavily exploited systems such as the Grand Banks cod fishery (which might never recover).
Apart from the obvious practical importance of these curves, what they show is that the function of the species, not their identity is what determines the shape of the BEF relation. In this case, despite its aparent complexity, the system is really very simple: just made up of predator-prey (trophic) relations and the only function represented is that of consuming. The only difference among the species here is their trophic level. So the question which arises is what would the curve look like if we had included all the ecological interactions, including parasitism and mutualism? Further, the connections among the organisms are not random, nor so simply ordered as in the fish example in Fung et al. (2015). Indeed, the specific web of interconnections of a real ecological community are an embodiment of functional information in themselves.
Fung, T. Farnsworth, K.D. Reid, D.G., Rossberg A.G. (2015). Impact of biodiversity loss on production in complex marine food webs mitigated by prey-release. Nature Comms. 6. 10.1038/ncomms7657
In practice, fishing, forestry and other human activities are not affecting species at random: typically the largest, longest living and highest in foodchains (trophic level) organisms are most at risk. Fung et al. 2015, went on to examine the effect of deleting species in rank order and the result was even more striking.
Deleting in reverse order of trophic level (green line) actually caused an initial increase in ecosystem function, before it crashed down after about 2/3 of the species had been eliminated. Conversely, deleting in reverse order of the biomass of individual species populations (red line) resulted in a curve that declined sharply as the first few species were deleted and gradually smoothed out, but at significantly lower production than all the other scenarios. The, often assumed, Michaelis-Menten shape was lost in both these cases and clearly only pertains to random species deletion. Since overfishing typically depleats species from highest to lowest trophic level, the green line is to be expected and this may explain the prevalence of sudden crashes in heavily exploited systems such as the Grand Banks cod fishery (which might never recover).
Apart from the obvious practical importance of these curves, what they show is that the function of the species, not their identity is what determines the shape of the BEF relation. In this case, despite its aparent complexity, the system is really very simple: just made up of predator-prey (trophic) relations and the only function represented is that of consuming. The only difference among the species here is their trophic level. So the question which arises is what would the curve look like if we had included all the ecological interactions, including parasitism and mutualism? Further, the connections among the organisms are not random, nor so simply ordered as in the fish example in Fung et al. (2015). Indeed, the specific web of interconnections of a real ecological community are an embodiment of functional information in themselves.
Fung, T. Farnsworth, K.D. Reid, D.G., Rossberg A.G. (2015). Impact of biodiversity loss on production in complex marine food webs mitigated by prey-release. Nature Comms. 6. 10.1038/ncomms7657